SN6: Multi-Sensor All-Weather Mapping
The Problem
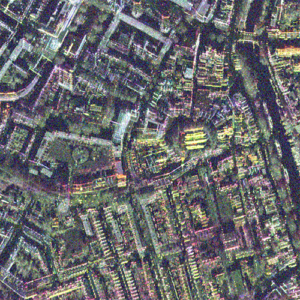
Synthetic Aperture Radar (SAR) is a unique form of radar that can penetrate clouds, collect during all- weather conditions, and capture data day and night. Overhead collects from SAR satellites could be particularly valuable in the quest to aid disaster response in instances where weather and cloud cover can obstruct traditional electro-optical sensors. However, despite these advantages, there is limited open data available to researchers to explore the effectiveness of SAR for such applications, particularly at ultra-high resolutions.
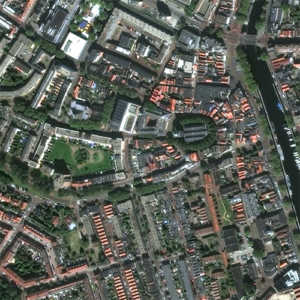
The task of SpaceNet 6 was to automatically extract building footprints with computer vision and artificial intelligence (AI) algorithms using a combination of SAR and electro-optical imagery datasets. This openly-licensed dataset features a unique combination of half-meter Synthetic Aperture Radar (SAR) imagery from Capella Space and half-meter electro-optical (EO) imagery from Maxar’s WorldView 2 satellite. The area of interest for the challenge was centered over the largest port in Europe: Rotterdam, the Netherlands. This area features thousands of buildings, vehicles, and boats of various sizes, to make an effective test bed for SAR and the fusion of these two types of data.
In this challenge, the training dataset contained both SAR and EO imagery, however, the testing and scoring datasets contained only SAR data. Consequently, the EO data could be used for pre-processing the SAR data in some fashion, such as colorization, domain adaptation, or image translation, but cannot be used to directly map buildings. The dataset was structured to mimic real-world scenarios where historical EO data may be available, but concurrent EO collection with SAR is often not possible due to inconsistent orbits of the sensors, or cloud cover that will render the EO data unusable.
AWS GPU Credits
The first 30 registrants with a submission equaling or exceeding the set performance threshold received a credit for 10 hours on a p3.2xlarge for training and improving their models.
RELATED BLOGS
- SpaceNet 6: Expanded Dataset Release
- SpaceNet 6: Winning Model Release
- SpaceNet 6: Data Fusion and Colorization
- SpaceNet 6: Exploring Foundational Mapping at Scale
- Deploying the SpaceNet 6 Baseline on AWS
- SpaceNet 6: Announcing the Winners
- SpaceNet 6 Challenge Launch
- The SpaceNet 6 Baseline
- SAR 201: An Introduction to Synthetic Aperture Radar, Part 2
- SAR 101: An Introduction to Synthetic Aperture Radar
- SpaceNet 6: Dataset Release
- Announcing SpaceNet 6: Multi-Sensor All Weather Mapping
The Data – Over 120 sq km of both high resolution synthetic aperture radar (SAR) data and electro optical (EO) imagery with ~48,000 building footprint labels of Rotterdam, The Netherlands
| AOI | Area of Raster (Sq. Km) | Building Footprint Labels (Km) |
|---|---|---|
| AOI_11_Rotterdam | 120 | 48,000 |
Catalog
aws s3 ls s3://spacenet-dataset/spacenet/SN6_buildings/
Training Data
AOI 11 – Rotterdam – Buildings
To download processed ~450mx450m tiles with associated buildings footprint labels of AOI 11 Rotterdam (39.0 GB):
aws s3 cp s3://spacenet-dataset/spacenet/SN6_buildings/tarballs/SN6_buildings_AOI_11_Rotterdam_train.tar.gz . Testing Data
AOI 11 – Rotterdam – Buildings
To download processed 450mx450m tiles of AOI 11 Rotterdam (16.9 GB):
aws s3 cp s3://spacenet-dataset/spacenet/SN6_buildings/tarballs/SN6_buildings_AOI_11_Rotterdam_test_public.tar.gz .Expanded Dataset
In September 2020, the SpaceNet partners released an expanded version of the SpaceNet 6 dataset. The dataset is untiled and distributed in its maximum extent to enable research using combinations of SAR and optical imagery. All of the SAR data comes from Capella Space’s X-band quad-pol sensor mounted on an aircraft. We distribute 202 SAR image strips in two formats: one with minimal pre-processing (Single Look Complex) as well as a second set of new six-band georeferenced products that include 4 channels of intensity and 2 channels derived from a Pauli decomposition. The decomposition channels show different types of scattering behavior. Many of these strips overlap to create a dense stack of SAR data with multiple revisits spanning a three-day time period in August 2019. The extent of these image strips covers a large portion of Rotterdam and 120 km² of total area, with each strip spanning approximately 0.7 km by 10 km.
Complimentary to our SAR data, we also release our untiled Maxar WorldView 2 image spanning ~92 km² at 0.5m spatial resolution. We distribute 4 image products including the panchromatic band, pan-sharpened RGB and RGBNIR data (0.5m) and RGBNIR data (2.0m). As in the challenge, we hold back the optical data over the final testing area but distribute these optical data for validation and training.
Visit our blog for more information on the SpaceNet 6 Expanded Dataset.
AOI 11 – Rotterdam – Buildings
To explore the full expanded dataset in AOI 11 Rotterdam:
aws s3 ls s3://spacenet-dataset/AOIs/AOI_11_Rotterdam/ The Metric
In the SpaceNet Multi-Sensor All-Weather Mapping Challenge, the metric for ranking entries was the SpaceNet Metric. This metric is an F1-Score based on the intersection over union of two building footprints with a threshold of 0.5 F1-Score is calculated by taking the total True Positives, False Positives, and False Negatives for the total number of building footprints present in the testing datasets.
Citation Instructions
Shermeyer, J., Hogan, D., Brown, J., Etten, A.V., Weir, N., Pacifici, F., Hänsch, R., Bastidas, A., Soenen, S., Bacastow, T.M., & Lewis, R. (2020). SpaceNet 6: Multi-Sensor All Weather Mapping Dataset. 2020 IEEE/CVF Conference on Computer Vision and Pattern Recognition Workshops (CVPRW), 768-777.
License

The SpaceNet Dataset by SpaceNet Partners is licensed under a Creative Commons Attribution-ShareAlike 4.0 International License.